Dashboards for cloud data monitoring are digital interfaces that display information about cloud infrastructure, applications, databases, storage systems, and network activity.
They collect and organize operational data into charts, tables, status indicators, and alerts, helping users understand how cloud environments are performing. These dashboards are used by developers, system administrators, data analysts, security teams, and organizations that operate applications through cloud platforms.
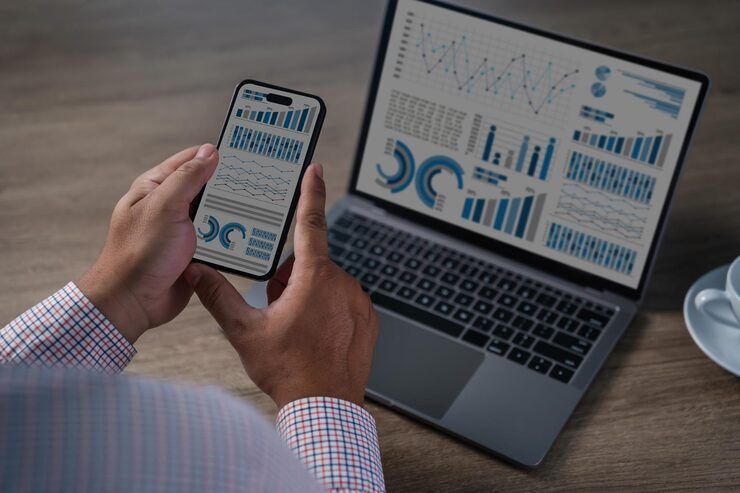
Cloud computing allows computing resources to be accessed over networks instead of relying entirely on locally maintained hardware. As organizations move applications and data into cloud environments, monitoring becomes important for understanding system performance, availability, resource consumption, and potential problems. Dashboards bring information from different monitoring sources into a format that is easier to interpret.
A cloud monitoring dashboard may display processor usage, memory consumption, storage capacity, network traffic, application response times, database activity, and system errors. Some dashboards also include security events, access patterns, service health information, and data-processing results. The exact information depends on the cloud provider, monitoring platform, and configuration.
How Cloud Data Monitoring Dashboards Work
Cloud monitoring generally involves collecting measurements and events from cloud resources, sending them to a monitoring platform, and presenting selected information through a dashboard. Data may come from virtual machines, containers, databases, application logs, serverless functions, or managed cloud services.
Metrics describe measurable values, such as CPU utilization or the number of application requests. Logs record events generated by systems and applications, while traces show how requests move through connected components. Dashboards can combine these sources to help users investigate changes in system behavior.
For example, if an application becomes slow, a dashboard may show increased processor usage, database delays, or a rise in failed requests. This information helps technical teams narrow down possible causes, although additional investigation may be needed to identify the underlying problem.
Common Types of Cloud Monitoring Dashboards
Cloud dashboards serve different purposes depending on the information being monitored.
- Infrastructure dashboards: Display processor usage, memory, storage, and virtual machine health.
- Application performance dashboards: Track response times, errors, request volumes, and application availability.
- Database dashboards: Show query performance, connection counts, storage growth, and database errors.
- Network dashboards: Present traffic levels, latency, packet loss, and connection activity.
- Security dashboards: Organize authentication events, access changes, suspicious activity, and selected security alerts.
- Data pipeline dashboards: Track data ingestion, processing delays, failed tasks, and data quality indicators.
These dashboard categories can be combined into a shared monitoring environment, provided the underlying systems supply compatible information and access permissions are configured appropriately.
Importance
Dashboards for cloud data monitoring are important because cloud environments often contain many connected resources operating simultaneously. Without an organized view of system activity, identifying performance changes or failures can require examining several separate tools and data sources.
Monitoring information helps technical teams understand whether applications are responding normally, whether infrastructure is approaching its capacity limits, and whether data-processing tasks are completing as expected. It also supports operational planning by showing patterns in resource usage over time.
Improving Application Reliability
Application reliability depends on several factors, including infrastructure health, database performance, network conditions, and software behavior. A monitoring dashboard can display these factors together, helping teams recognize relationships between different events.
For example, an increase in application response time may occur alongside a rise in database query duration. By comparing these measurements, a team can investigate whether database activity contributes to the delay. Dashboards support diagnosis but do not automatically establish the cause of every incident.
Managing Cloud Resources
Cloud environments may use virtual machines, containers, databases, object storage, and serverless computing resources. Their usage can change throughout the day as demand rises or falls.
Resource monitoring helps teams identify unused capacity, overloaded components, and unusual consumption patterns. Historical charts can also support capacity planning by showing how resource requirements change over time. Actual resource adjustments still depend on application requirements and operational decisions.
Supporting Security Awareness
Security dashboards can organize information from identity systems, network controls, application logs, and cloud audit records. They may highlight repeated failed login attempts, unusual access patterns, unexpected configuration changes, or other events requiring investigation.
A dashboard is only as useful as its data sources, detection rules, and alert configuration. Missing logs, incorrect permissions, or poorly designed alerts can reduce visibility. Monitoring should therefore form part of a wider security approach that includes access controls, software updates, incident procedures, and regular reviews.
Common Cloud Monitoring Metrics
| Metric | What it measures | Why it matters |
|---|---|---|
| CPU utilization | Processor activity | Identifies computing pressure |
| Memory usage | Active memory consumption | Helps detect memory limitations |
| Network latency | Time taken for data to travel | Helps assess responsiveness |
| Request error rate | Proportion of failed requests | Indicates possible application problems |
| Response time | Time taken to respond to requests | Supports performance analysis |
| Storage utilization | Used storage capacity | Helps anticipate capacity limits |
| Database connections | Active or available connections | Reveals connection pressure |
| Data pipeline delay | Time between expected and actual processing | Helps track data freshness |
The meaning of each metric depends on the system being monitored. A single measurement rarely provides enough information to explain a complex operational issue.
Recent Updates
Developments during 2024–2026 have continued to shape cloud data monitoring through artificial intelligence-assisted analysis, unified observability, cloud-native monitoring, and greater attention to security and data governance. The precise capabilities vary across platforms and are changing as cloud providers and software developers update their products.
AI-Assisted Monitoring
Some monitoring platforms use machine learning to identify unusual patterns, group related alerts, summarize incidents, or suggest possible causes of performance problems. These functions can help teams review large volumes of operational information.
However, automated analysis can produce incorrect or incomplete conclusions. Results depend on the quality of monitoring data, the model's capabilities, and the complexity of the environment. Human review remains important when investigating significant incidents or making changes to production systems.
Unified Observability
Observability brings together metrics, logs, and traces to provide a broader view of application behavior. Cloud-native applications often use containers, microservices, and distributed databases, making it difficult to understand an incident from one measurement alone.
Unified dashboards can connect information across these components and help teams follow requests through different stages of processing. OpenTelemetry has become an important open-source framework for generating and collecting telemetry data across supported systems.
Cloud-Native and Container Monitoring
Container platforms such as Kubernetes create monitoring needs involving clusters, nodes, workloads, and individual containers. Dashboards can display resource usage, workload status, restart events, and application health checks.
As organizations adopt more distributed application architectures, monitoring systems increasingly support integrations with orchestration platforms and managed cloud services. Effective monitoring still requires suitable configuration, meaningful metrics, and attention to data collection overhead.
Security and Data Governance
Cloud monitoring increasingly intersects with identity management, audit logging, compliance reporting, and security operations. Organizations may need to track who accessed a resource, which configuration changed, and whether sensitive information entered an unexpected workflow.
Data retention, access permissions, and privacy controls are important when logs contain personal information, account identifiers, or application details. Monitoring policies should specify which information is collected, who can view it, and how long records are retained.
Laws or Policies
Cloud data monitoring is affected by privacy legislation, cybersecurity requirements, industry regulations, contractual obligations, and cloud provider policies. Applicable requirements depend on the country, the type of data, the industry, and the location of the people or systems involved.
Data Protection Rules in India
India's Digital Personal Data Protection Act, 2023, establishes a legal framework for processing digital personal data, subject to its scope and applicable provisions. The Digital Personal Data Protection Rules, 2025, and their commencement arrangements are also relevant to understanding implementation requirements.
Organizations using cloud monitoring should assess whether their logs and telemetry contain personal data and determine which obligations apply to their processing activities. Appropriate safeguards may include access restrictions, data minimization, defined retention practices, and suitable arrangements with relevant data processors.
India's Information Technology Act, 2000, and applicable rules or cybersecurity directions may also be relevant, depending on the organization and activity. The specific legal obligations should be assessed against current requirements rather than assumed to be identical for every cloud environment.
International Privacy and Security Frameworks
The European Union's General Data Protection Regulation may apply when an organization processes personal data within its scope. In the United States, sector-specific requirements and state privacy laws may affect particular organizations and data types.
Technical frameworks such as ISO/IEC 27001 and the NIST Cybersecurity Framework provide guidance for information security risk management. They are not automatically laws in every jurisdiction, although organizations may adopt them to structure their security programs or satisfy applicable contractual requirements.
Responsible Monitoring Practices
Organizations generally need to consider several operational safeguards:
- Limit dashboard access according to users' responsibilities.
- Protect monitoring data in transit and at rest.
- Avoid collecting sensitive information that is unnecessary for the monitoring purpose.
- Set appropriate retention periods for logs and telemetry.
- Record important access and configuration changes.
- Review alert rules and access permissions periodically.
- Maintain incident response procedures for security-related alerts.
These practices support responsible monitoring, but legal compliance depends on the specific circumstances and applicable rules.
Tools and Resources
Several platforms help users build dashboards for cloud data monitoring. The appropriate choice depends on the cloud environment, the technical skills available, the required metrics, data retention needs, and integration requirements.
Common Cloud Monitoring Platforms
- Amazon CloudWatch: Monitors supported AWS resources and applications using metrics, logs, alarms, and dashboards.
- Microsoft Azure Monitor: Collects and analyzes monitoring information from supported Azure resources and applications.
- Google Cloud Monitoring: Provides metrics, dashboards, alerting, and monitoring functions for Google Cloud environments.
- Grafana: Creates dashboards from supported data sources and is commonly used for infrastructure and application monitoring.
- Prometheus: Collects and stores time-series metrics and supports alerting workflows, particularly in cloud-native environments.
- Datadog: Provides an observability platform for supported infrastructure, applications, logs, and security-related information.
- OpenTelemetry: Supplies vendor-neutral components and standards for collecting telemetry data from applications and systems.
These tools differ in architecture, integrations, licensing, deployment methods, and pricing arrangements. Some are closely integrated with particular cloud ecosystems, while others can collect information from multiple sources.
Designing a Useful Dashboard
A well-organized dashboard should focus on a defined monitoring purpose. An infrastructure dashboard may prioritize CPU, memory, storage, and network performance, while an application dashboard may emphasize response times, errors, and request volumes.
Useful design practices include grouping related metrics, using consistent time ranges, labeling units clearly, and setting thresholds based on actual operating requirements. Too many charts or poorly configured alerts can make important information harder to identify.
Documentation should explain what each metric represents, where the data originates, and what actions are appropriate when a threshold is crossed. This helps users interpret information consistently across teams.
FAQs
What is a cloud data monitoring dashboard?
A cloud data monitoring dashboard is an interface that displays measurements, logs, alerts, and other information from cloud infrastructure and applications. It helps users review performance, availability, resource consumption, and selected security events.
Which tools are used for cloud monitoring dashboards?
Common tools include Amazon CloudWatch, Azure Monitor, Google Cloud Monitoring, Grafana, Prometheus, and Datadog. The suitable platform depends on the cloud provider, data sources, technical requirements, and monitoring objectives.
What metrics should a cloud monitoring dashboard display?
Common metrics include CPU utilization, memory usage, network latency, application response time, error rates, storage consumption, and database performance. The selected metrics should reflect the system's operational requirements.
How do cloud monitoring dashboards support security?
They can organize authentication records, audit logs, configuration changes, and security alerts. These views help teams investigate unusual activity, but effective security also requires suitable access controls, detection rules, and incident response procedures.
How are cloud monitoring dashboards different from observability platforms?
A dashboard presents selected information in a visual format, while observability platforms generally provide broader capabilities for collecting, searching, correlating, and analyzing metrics, logs, and traces. Many observability platforms include dashboards as one of their features.
Conclusion
Dashboards for cloud data monitoring help users understand infrastructure health, application performance, resource usage, and selected security events through organized visual information. Recent developments include AI-assisted analysis, unified observability, container monitoring, and closer integration with security controls. Their effectiveness depends on reliable telemetry, meaningful metrics, appropriate alert settings, and well-managed access permissions. Privacy obligations and security practices remain important considerations when monitoring cloud systems.